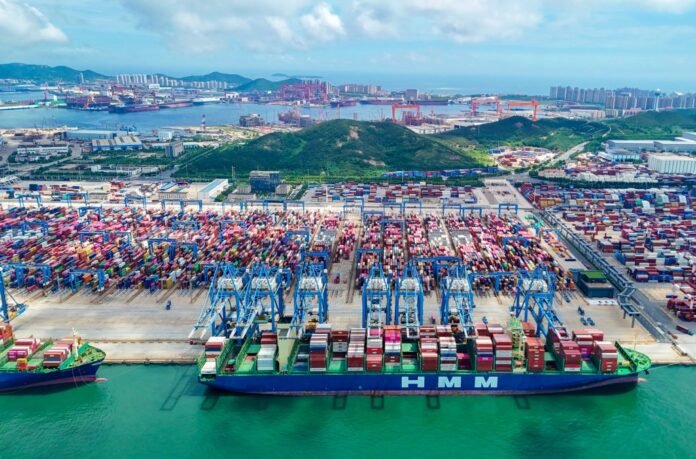
Ocean freight rates out of China to the U.S. are still falling after their strong spike in May, and are expected to further decline through the coming months, especially if a projected end-of-summer demand slump plays out.
Drewry’s July Container Forecaster projects the supply-demand balance to weaken again in the second half of the year, which would cause the spot rate dip.
While there was much concern over the amount of space available on container ships in May when the U.S. first rolled back its tariffs on China for 90 days, the pendulum has heavily swung back to overcapacity on the Pacific Ocean, which is a catalyst for lower freight rates.
According to Drewry, the volatility and timing of rate changes will depend on President Donald Trump’s future tariffs and on capacity changes related to the introduction of the U.S. penalties on Chinese ships, which are uncertain.
Container shipping consultancy Linerlytica noted that increased clarity on the tariffs will reduce the need for shippers to rush out shipments before the new Aug. 1 deadline, further pressuring trans-Pacific freight rates.
Major indices are showing more declines, with the Drewry World Container Index dipping for the fourth straight week from China to the U.S. East and West Coasts. As of Thursday, freight rates from Shanghai to Los Angeles decreased 8 percent to $2,931 per 40-foot container, while Shanghai-to-New York rates dipped 5 percent to $4,839.
Drewry expects spot rates to continue to decline next week as well due to excess capacity and weak demand.
Last Friday, the Shanghai Containerized Freight Index from Shanghai to the U.S. West Coast plunged 19 percent from the week prior to $2,089 per container. The East Coast counterpart dropped 13 percent to $4,124 on average.
Despite the U.S. and China agreeing to a framework for a trade deal that lowered tariffs back down to 55 percent, shipments remain far down from 2024 levels, contributing to the rapid rate decline throughout June.
In June, U.S. imports of containerized goods from China still fell 28.3 percent year over year to 639,300 20-foot equivalent units (TEUs), according to a monthly report from supply chain technology provider Descartes. China’s share of total U.S. container imports hit a four-year low at 28.8 percent, reflecting the sustained impact of the elevated tariffs.
With fewer Chinese cargo expected to enter the U.S. in August into the fall months, ocean carriers will be monitoring capacity levels to hold rates up.
Mediterranean Shipping Company (MSC) is the first of the major carriers to withdraw a service line “until further notice” in an effort to get excess capacity out of the trans-Pacific trade lane.
The suspended Pearl service connected ports including Vietnam’s Cai Mep and Hai Phong; Hong Kong; China’s Yantian, Xiamen and Nansha; and Long Beach and Oakland in the U.S.
The last sailing on the Pearl service will be made by the 8,819-TEU MSC Elodie from Xiamen on July 13, according to Linerlytica.
Other carriers including Hong Kong-based TS Lines and China United Lines, both of which reintroduced service lines when demand opened up, again pulled the plug on their sailings.
Such moves remain “insufficient” to bring stability back to what Linerlytica called a “very crowded” trans-Pacific market with 23 carriers currently active on the Far East-to-U.S. route.
The consultancy is not convinced the cuts from MSC and others will make much of a dent in the trend.
“Further capacity cuts are required in the next four weeks, with the removal of some 30,000 TEUs per week needed before carriers will have any realistic chance of reversing the rate slump,” Linerlytica said.
Container capacity has gotten more volatile over the years
As rates seem more likely to drift downward, the level of capacity on container vessels appears to be more volatile than ever—making rates more unpredictable.
Container shipping research firm Sea-Intelligence says total capacity on the Asia to North American West Coast route has nearly quadrupled compared to 2012 levels. For the past three years, capacity volatility has been ranging around 250 percent higher than in 2012, with variability often reaching up to 300 percent higher.

Sea-Intelligence
According to Sea-Intelligence CEO Alan Murphy, this volatility is caused by blank sailings, vessels sailing off-schedule and vessels of varying size on the same service.
“To the degree that spot rates are driven by the actual weekly supply-demand balance, this capacity volatility means that the underlying driver for spot rate formation on Asia-NAWC has become progressively more unstable over the past 13 years—creating a much more volatile and unpredictable spot rate in itself,” Murphy said.
To calculate the volatility, Sea-Intelligence took the absolute value of the week-over-week change in capacity, so that any change is recorded as a positive value. From there, the firm calculated capacity volatility as a 52-week moving average.


